Once you’ve invested in the workflow automation game, it’s essential to track the ROI of your spend. This update is dedicated to the new reporting functionality that details the performance of you and your team. We will also recap all the reporting and analytics capabilities of PandaDoc in this post.
Go beyond traditional sales reporting
Sales excellence is all about the numbers. Because you can’t improve what you can’t measure, we created a new reporting console containing comprehensive performance metrics. This feature is a must-have for any business or sales leaders looking to keep an eye on sales performance… which is everyone, right?
The reporting metrics include document funnel, time-to-close, document close rate, and performance metrics for each team member. These metrics are measured by number and value of the documents in the sent, viewed, and complete stages.
Let’s dive deeper.
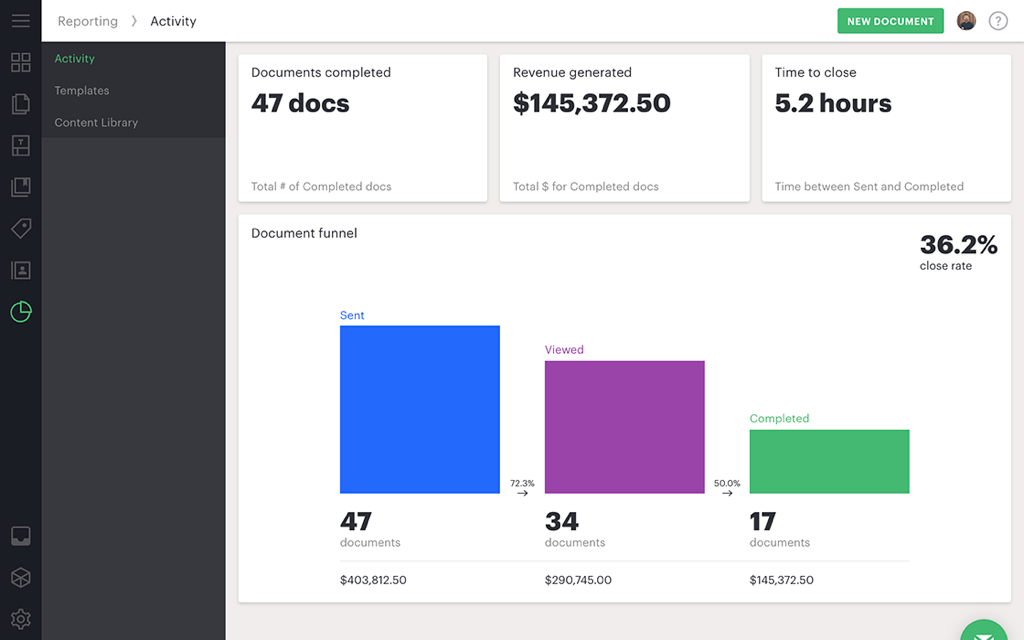
Activity reporting
The new Activity reporting console shows statistics for your workspace, including:
- The number of completed documents
- The revenue of the documents in your default currency
- Average time to close
Leverage these metrics to identify gaps and improve your document workflow.
The document close rate and time-to-close are unique KPIs which are not available anywhere else. These metrics are similar to those traditionally found in your CRM. By comparing PandaDoc metrics alongside your CRM numbers, you can identify the bottlenecks in your sales process and make the necessary adjustments either in your sales approach or your document content. If you do not use a CRM, the activity reporting can be used as a sales performance dashboard.
Let us share some benchmarks before you define your target value for close rate and time to close. On the average, every third document in PandaDoc is completed, typically within 6 hours of being sent. Using the custom date range selector, you can gather and analyze historical data and monitor how your indicators vary over time.
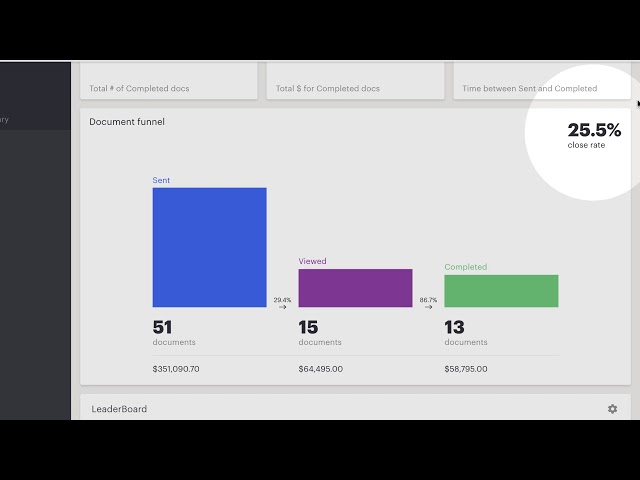
Identify process bottlenecks in early stages
The document funnel board visualizes the main steps of your documents with conversion rates between different stages. This diagram will help to identify where documents are stalled. For example, if you see most documents are not viewed, you can set up reminders and notifications or plan an in-person touch with the recipient shortly after the document is sent.
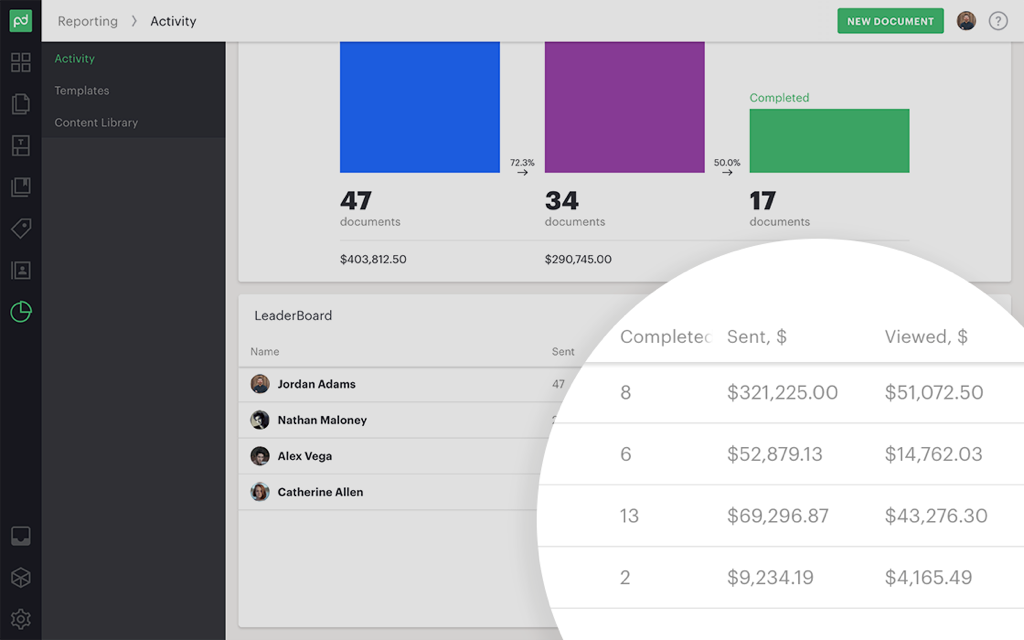
Get insights on both team and individual performance
The Leaderboard lists all of the team members in your workspace and their stats on the number of documents they’ve worked with and the associated revenue of their documents. This list is an excellent visualization of the leaders on your team and who needs some guidance and support to meet their quotas or other KPIs.
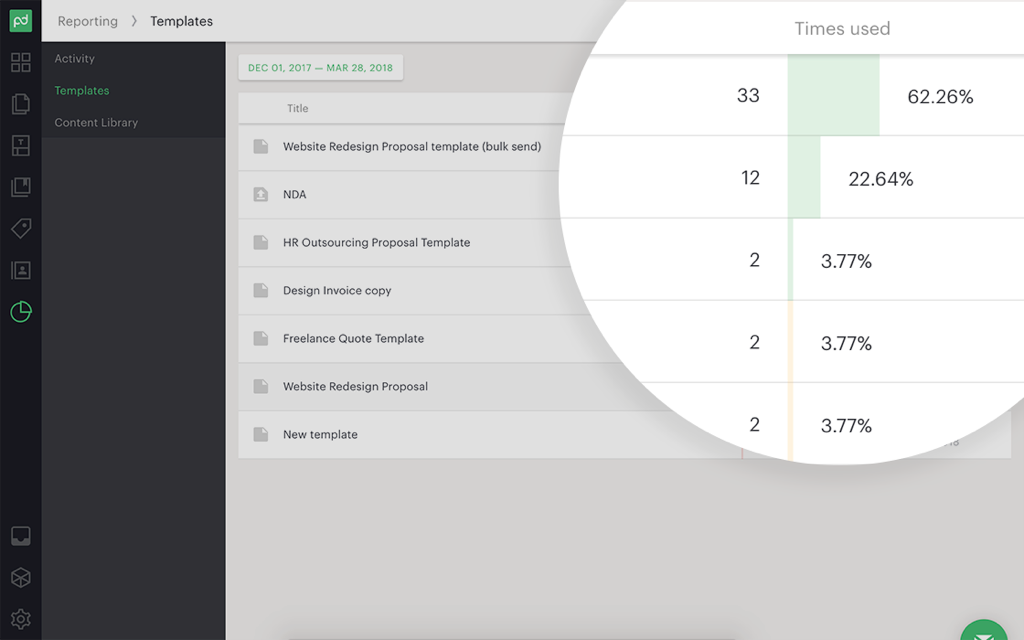
Content usage reporting (templates and content library)
Under the Content and Templates reporting tabs, you will also find the numbers behind how often you and your colleagues use templates and content blocks from your library. This information is best handled by content owners (e.g., your marketing team) to gather insight into what content is used and what’s not. Content usage reporting is also helpful in planning future content.
Enable the Reporting feature in the Add-On store, or upgrade to the Enterprise plan.
Analytics and reporting functionality overview
We’ve added a lot of functionality to our analytics and reporting features, so let’s recap everything that’s available:
Dashboard with Smart lists
The dashboard is an overview of the number and value of documents in each document and payment stage. You can break this data down by a week, a month, a quarter, and a year and view the data for each team member in your workspace. This data coupled with the timeline, help track important changes and react accordingly (a timely follow-up or a reminder can make a huge difference). Available for every plan.
Document analytics per recipient
Get actionable insights on how customers interact with your documents. You can see how many times your recipient viewed the document, how much time they spent on each page, whether they downloaded it or not, and the last time they viewed it. Available for every plan.
New reporting module
The Reporting module in your PandaDoc sidebar includes activity reporting and the number of templates and content library usage for any custom period. Advanced reporting is available for Enterprise users and can be enabled in the Add-On store.
When you’re ready, try all of these features by logging into your PandaDoc account or starting a free 14-day trial.